#
Visualizing ACLs with Adalanche
#
Visualizing ACLs with Adalanche
I was always a fan of trying new tools in order to create a personal arsenal for edged cases. Recently, I found a tool called Adalanche, which is capable of enumerating and visualizing ACLs between entities in the scope of the Active Directory.
Usually, Active Directory misconfigurations can be found within the ACLs, and they can often lead to obtaining domain administrative privileges by chaining various lateral movement or privilege escalation techniques together. A very simple example for that can be a vulnerable ADCS server to ESC1 attack. Another example could be finding out that the current owned user is local administrator on some machine and after data exfiltration, you find domain admin credentials.
Mapping such attack vectors can be complicated without such tools, and while you should not be dependant of them, they are here to help, and they certainly do!
While BloodHound is my rank #1 tool for enumerating and visualizing the Active Directory, I was also thrilled to try Adalanche, mainly because of curiosity in terms of UI, practical use and evasiveness. Turned out that this tool might be a hidden gem!
If you prefer watching a video instead of reading, I already deployed a video about the topic on my channel:
Also make sure to join my Discord where we share experience, knowledge and doing CTF together.
And if you have further appreciation for my work, don't hesitate to become my Patreon!
#
Why not just use BloodHound?
Now here comes the question, why bother with Adalanche when I have BloodHound?
The answer is very simple, it is always a good idea to have alternatives for specific tools. Also, alternatives creates competition and this is a fundamental process of improving both of the sides, so its a win = win situation.
Additionally, as you might already know, SharpHound (The data collector for BloodHound) is extremely signatured by various security mechanisms. I am aware that the signatures and the behavioral detections can be bypassed but sometimes its not a trivial process. For Instance, it is possible to land into an environment that is extremely well network segmented, so that you cannot get a C2 implant to run and you should rely on some kind of workarounds such as bind shells on specific ports, which not all C2 framework actually supports. Additionally, its possible that the network is restricted in such way, that you cannot just execute the python collector. On top of that, if the segmentation is combined with enforced endpoint protection, it can become even more challenging. This just makes the things more complicated and can effectively lose a day or two into just getting the basic AD enumeration.
On the other hand, Adalanche is a tool that can work as both a collector and a visualizer at the same time, while it is extremely evasive. Imagining the previous restricted scenario, if Adalanche is execute from a compromised machine with network access to the LDAP server, it is less likely to get detected and blocked.
When operating from C2 framework, the Adalanche binary can be executed with any PE-execution module, if your C2 supports such!
[BIG DISCLAIMER] I am aware that there are always various workarounds for all scenarios. The goal of this blog is not to question them, but to discuss and analyze the Adalanche tool.
Now, let's get an idea of what Adalanche actually looks like.
#
Adalanche Overview
Adalanche is go-written tool for collecting and analyzing data from Active Directory. It is capable of extracting potential attack vectors such as unconstrained delegation, ESC1, outdated servers, users with administrative privileges and more. It is extremely fast and compatible with each modern Operating System (OS).
One of the coolest features about Adalanche is that it is self-sufficient, which means, you do not need:
- Database (like Neo4j)
- Specific engine or runtime installed (like dotnet runtime)
- Additional software (like a web server)
All you need is the compiled binary and luck that you are in a vulnerable environment. Since the Adalanche is go-written, the same code can be compiled for both windows and *nix systems.
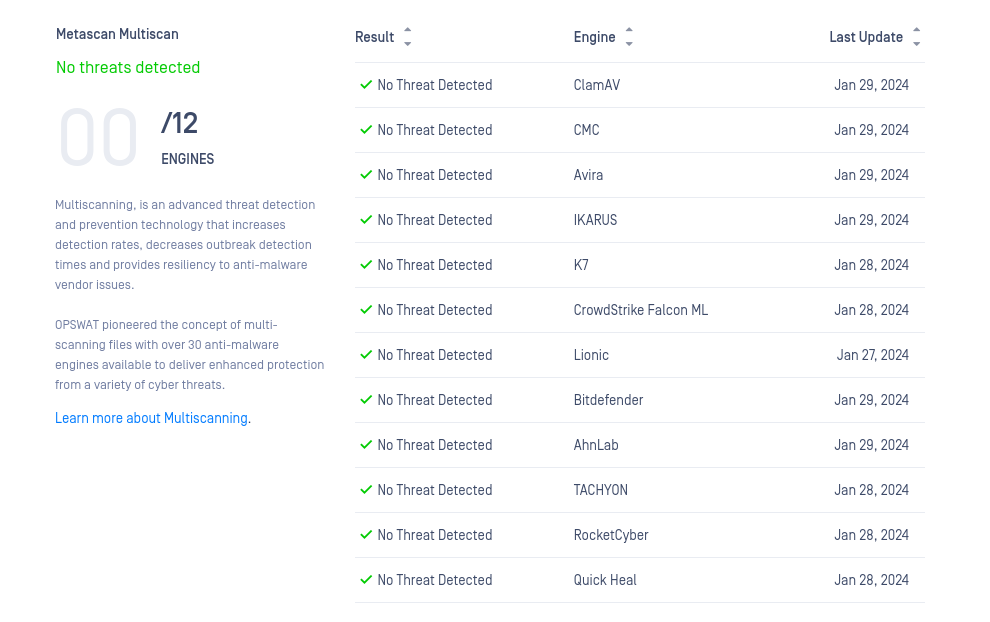
It is always a good idea to obfuscate the code and compile it yourself. Currently (January, 2024) the tool does not get signatured but most likely this will change in the near future!
Adalanche can be run directly, with no arguments if it is launched from a domain joined windows machine. On the other hand it can also mimic bloodhound.py, scraping the LDAP from a machine with network access to the Domain Controller. It then stores the gathered data into a folder called data, which can be analyzed in the future. Now let's analyze the different methods on how to get it running!
#
Case 1: I am operating from a domain joined Windows computer
Adalanche is capable of detecting the context of the current user. In case you are operating from a domain joined machine, and from the context of a domain user, you do not need to supply any arguments! In this scenario it is enough to just download and execute the binary.
This will perform all the scraping automatically, then Adalanche will automatically analyze the collected data and finally, it will host the results on 127.0.0.1:8080 while navigating your default browser to the web view.
If everything went smooth, you should see something like this:
#
Case 2: I am operating from a host with VPN access and AD credentials
Adalanche is also capable of scanning and extracting data from the Active Directory remotely. In this scenario, it is required to have network visibility to the LDAP servers as well as a valid pair of credentials for the Active Directory.
The Adalanche binary can now be used in 2 modes:
- collect
- analyze
The first mode will perform the data collection via querying the LDAP service. After completion, again, all of the results will be stored in a folder called data unless you specify something different.
All of the needed options can be found on the docs or by running:
./adalanche help collect activedirectory

11:24:06.425  INFORMA  Adalanche Open Source v2024.1.11 (commit 0161570), (c) 2020-2024 Lars Karlslund, This program comes with ABSOLUTELY NO WARRANTY
Collects information from Active Directory

Usage:
  adalanche collect activedirectory [flags]

Flags:
      --adexplorerboost         Boost ADexplorer performance by using loading the binary file into RAM before decoding it (default true)
      --adexplorerfile string   Import AD objects from SysInternals ADexplorer dump
      --attributes string       Comma seperated list of attributes to get, * = all, or a comma seperated list of attribute names (expert) (default "*")
      --authdomain string       domain for authentication, if using ntlm auth
      --authmode string         Bind mode: unauth/anonymous, basic/simple, digest/md5, kerberoscache, ntlm, ntlmpth (password is hash), negotiate/sspi (default "ntlm")
      --autodetect              Try to autodetect as much as we can, this will use environment variables and DNS to make this easy (default true)
      --configuration string    Collect Active Directory Configuration (default "auto")
      --domain string           domain suffix to analyze (contoso.local, auto-detected if not supplied)
      --gpopath string          Override path to GPOs, useful for non Windows OS'es with mounted drive (/mnt/policies/ or similar), but will break ACL feature
      --gpos string             Collect Group Policy file contents (default "auto")
  -h, --help                    help for activedirectory
      --ignorecert              Disable certificate checks
      --ldapdebug               Enable LDAP debugging
      --nosacl                  Request data with NO SACL flag, allows normal users to dump ntSecurityDescriptor field (default true)
      --objects string          Collect Active Directory Objects (users, groups etc) (default "auto")
      --other string            Collect other Active Directory contexts (typically integrated DNS zones) (default "auto")
      --pagesize int            Number of objects per request to collect (increase for performance, but some DCs have limits) (default 1000)
      --password string         password to connect with ex. --password hunter42 (use ! for blank password)
      --port int                LDAP port to connect to (389 or 636 typical, -1 for auto based on tlsmode) (default -1)
      --purgeolddata            Purge existing data from the datapath if connection to DC is successfull
      --schema string           Collect Active Directory Schema (default "auto")
      --server stringArray      DC to connect to, use IP or full hostname ex. -dc="dc.contoso.local", random DC is auto-detected if not supplied
      --tlsmode string          Transport mode (TLS, StartTLS, NoTLS) (default "NoTLS")
      --username string         username to connect with (someuser@contoso.local)

Global Flags:
      --cpuprofile                Save CPU profile from start to end of processing in datapath
      --cpuprofiletimeout int32   CPU profiling timeout in seconds (0 means no timeout)
      --datapath string           folder to store and read data (default "data")
      --embeddedprofiler          Start embedded Go profiler on localhost:6060
      --fgtrace                   Save CPU trace start to end of processing in datapath
      --logfile string            File to log to
      --logfilelevel string       Log file log level (default "info")
      --loglevel string           Console log level (default "info")
      --logzerotime               Logged timestamps start from zero when program launches
11:24:06.436  INFORMA  Terminating successfully
By following the options, this exemplary command can collect the data from the Active Directory:
./adalanche collect activedirectory --tlsmode tls --ignorecert --domain domain.local --authdomain DOMAIN --username joe --password joepass --server DCIPAfter this command finishes, the data folder will be present in your current working directory.
Since all of the collected AD information is stored into that data folder, you can also zip and ship it somewhere else. Keep in mind that the dump can be analyzed offline as soon as the Adalanche binary is present. As already mentioned, the same binary can be used for both collection and analyzing the data.
When you are ready to analyze the results and generate a web view, you can do so by running:
./adalanche analyzeIf everything is running as expected, you should again see the initial screen of Adalanche:
#
Adalanche Usage
Adalanche UI is divided into 3 parts:
- Object explorer on the left
- Nodes visualization settings on the right
- LDAP querying tool centered on the bottom.
On the Object explorer you can observe and analyze various objects, including present users, their groups, machines, Active Directory configurations and more.
The data from the object explorer is the raw data from the LDAP server. Here you can find the values in various object fields, such as object description
On the right, you can tweak how the Adalanche should look like, but I personally did not spend much time on it since I was happy with the defaults.
It is in the LDAP querying tool where it gets interesting.
Compared to BloodHound, Adalanche is not using any database engines for storing the results. It is based entirely on LDAP to perform any visualization and analysis over the collected data (which is purely stored on the local file system). To visualize the results, Adalanche uses web view, which can be configured with the option --bind 'IP:PORT'.
This behavior has its pros and cons such as :
Adalanche comes with the following predefined LDAP queries for visualizing nodes and searching for attack paths:
From these, you may notice that a lot of the queries are actually familiar from BloodHound (such as Kerberoastable users, DC Sync users and so on).
One of the coolest parts about Adalanche, is that when you execute one of the queries, you get its raw syntax inside the LDAP querying section, from where you can modify and update the query to suit your needs.
Additionally, the Start Query, Middle Query and End Query are query separators, which means, that you can implement your own custom nested queries for finding various attack paths, misconfigurations and vulnerabilities.
Of course, one negative aspect would be that you need to be doing good with LDAP in order to implement anything custom and to get the most out of Adalanche, but on the other hand, I found out that the default queries are working pretty nice. While I find the output from some of them confusing, others like Who can change GPOs, ESC1 vulnerable certificate templates and Who can dump SAM/SYSTEM can be extremely easy to understand and useful.
Lets analyze the above executed query: (&(type=Computer)(userAccountControl:1.2.840.113556.1.4.803:=524288)(!userAccountControl:1.2.840.113556.1.4.803:=8192)) which is designed to show all computers which are marked for Unconstrained Delegation, and are not Domain Controllers. While at first the output can be a little messy, it makes sense when you start reading the lines.
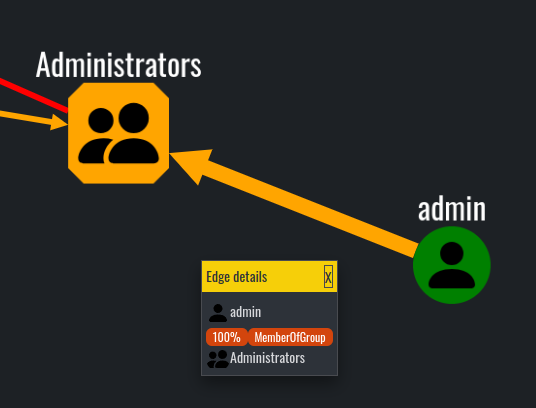
Similar to BloodHound, when you click on the paths between objects, you can get additional details about various attributes and relationships. It is not as informative as BloodHound(the path does not give exploitation guides), but still can be quite useful when you are already aware of the most common AD attacks. For example, when you see a red link between nodes, Adalanche claims that there are dangerous permissions between them.
By following the same logic, we can understand that the SQL02 is marked for Unconstrained Delegation, because its node is bigger and marked in red, compared to other machine accounts in the graph:
Additionally, the orange links most of the times mean that the object is a member of specific group, while the white usually means that there is some form of connection between objects which is not dangerous or exploitable.
With that, Adalanche has everything needed to find misconfigurations and vulnerabilities in the scope of the Active Directory. I know that there are a lot of features that are missing, compared to BloodHound, but still the essentials are here. One of the features I think Adalanche is lacking, is the exploitation docs on the node paths. Additionally, I found Adalanche hard to navigate and analyze specific single objects. Compared to BloodHound, where you can just type the object into the search box, here you would need to use LDAP queries. For example, in order to find a specific user, you can use the following LDAP query: (&(objectCategory=person)(objectClass=user)(sAMAccountName=username))
Other features such as what can this node pwn and what can pwn this node I found to be extremely useful and practical. These options can be utilized into setting up a target or a starting point.
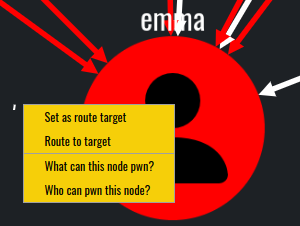
The whole idea of these options is to find attack paths to or from specific objects.
In this scenario, our user emma does not have direct dangerous and abusable ACLs toward any object in the domain.
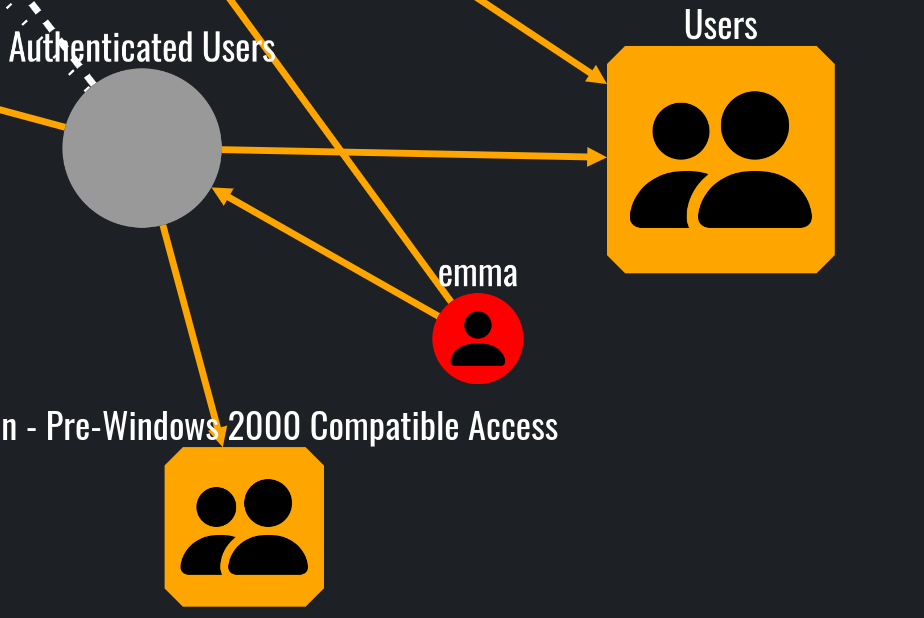
What can this node pwn? query
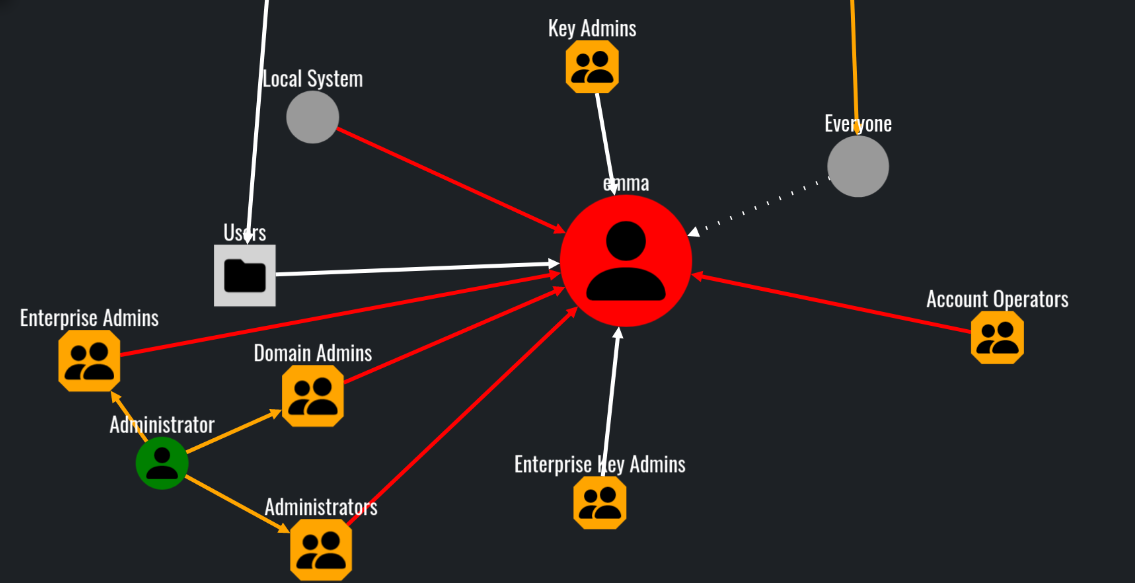
However, various objects can effectively influence and control emma:
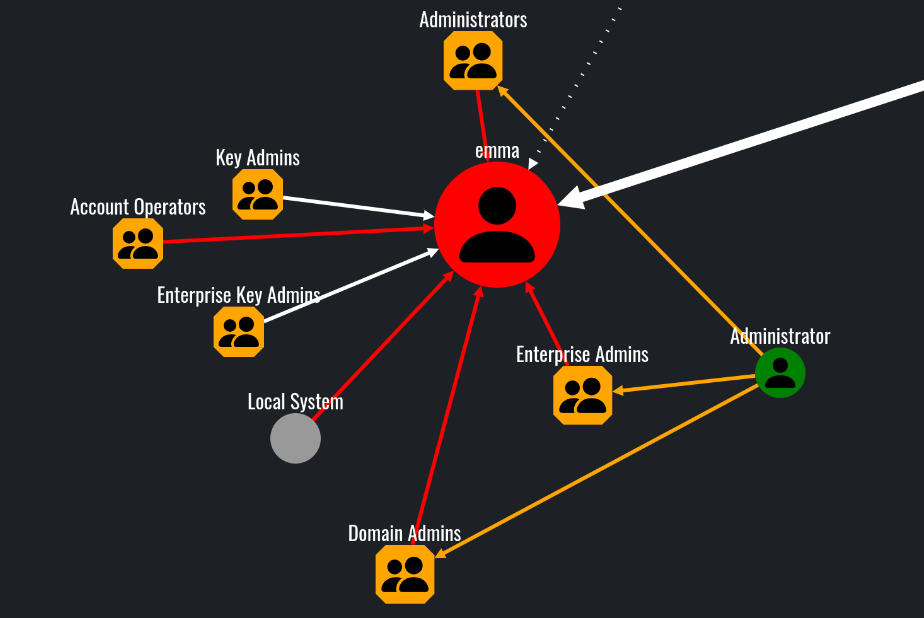
Who can pwn this node? query
Additionally, the options Set as route target and Route to target can be used to effectively display the attack path:
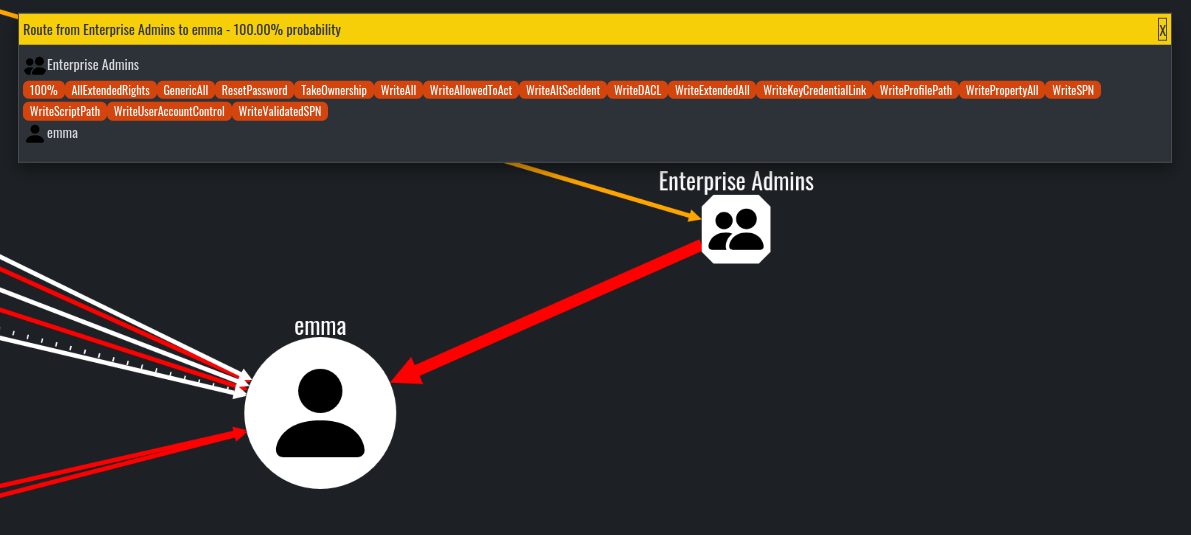
Route to target from Enterprise Admins group node
#
Conclusion
Now it is your turn to try out the tool and decide for yourself if it is worth it or not! In my opinion, compared to BloodHound, Adalanche is worst at visuals but still can present useful information and real attack paths.
While it can be initially confusing I think it is a great alternative which has its own pros and cons. I personally find the architecture pretty amazing and well done! The ability to be that flexible and evasive is something that must be credited, and we also need to acknowledge that the project is actively being developed and supported!
I highly encourage you to try it out on your own and decide whether it is useful in your cases.